
Reporting & Analytics
Estimated vs actual on every job, tied to payroll — a real P&L, company-wide or per branch, so you can see exactly where the money leaks.
Know your numbers — not your gut.
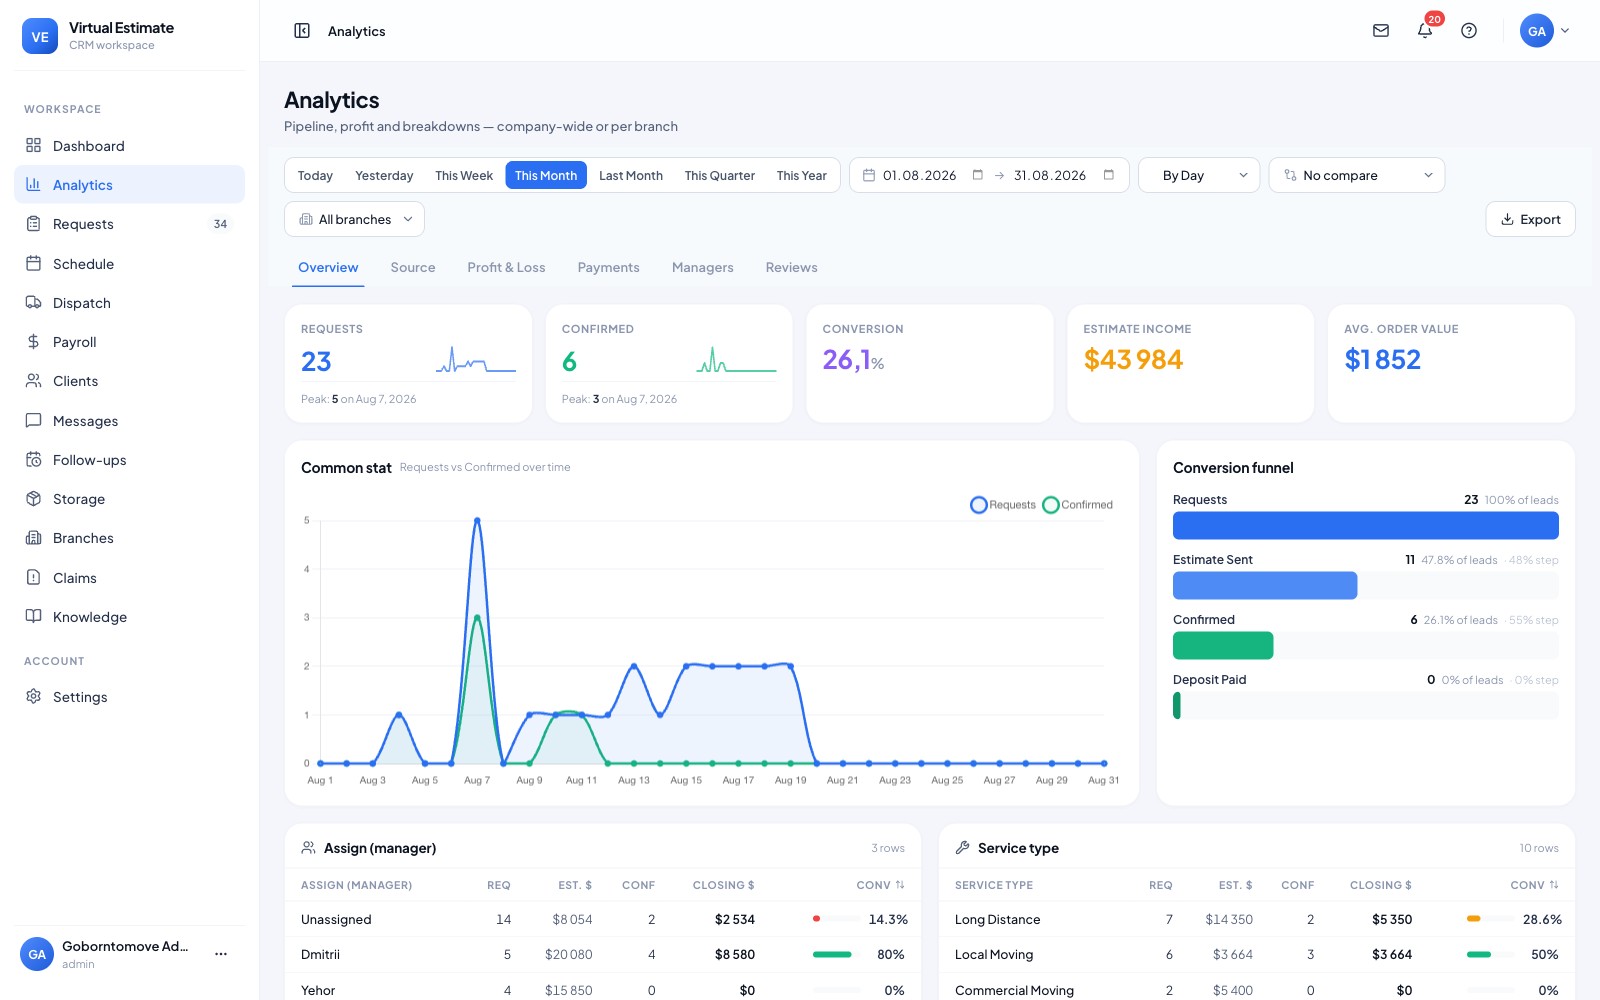
Dashboard KPIs, funnels and a real profit-and-loss view — company-wide or per branch — tied to the jobs you actually ran.
Every number that pays your bills — on one screen.
Revenue trends, jobs booked, pipeline health and top sources at a glance. Stop opening five tabs to know how the business is doing.
- ✓Revenue trends, 30-day or 12-month
- ✓Pipeline & stale-lead alerts
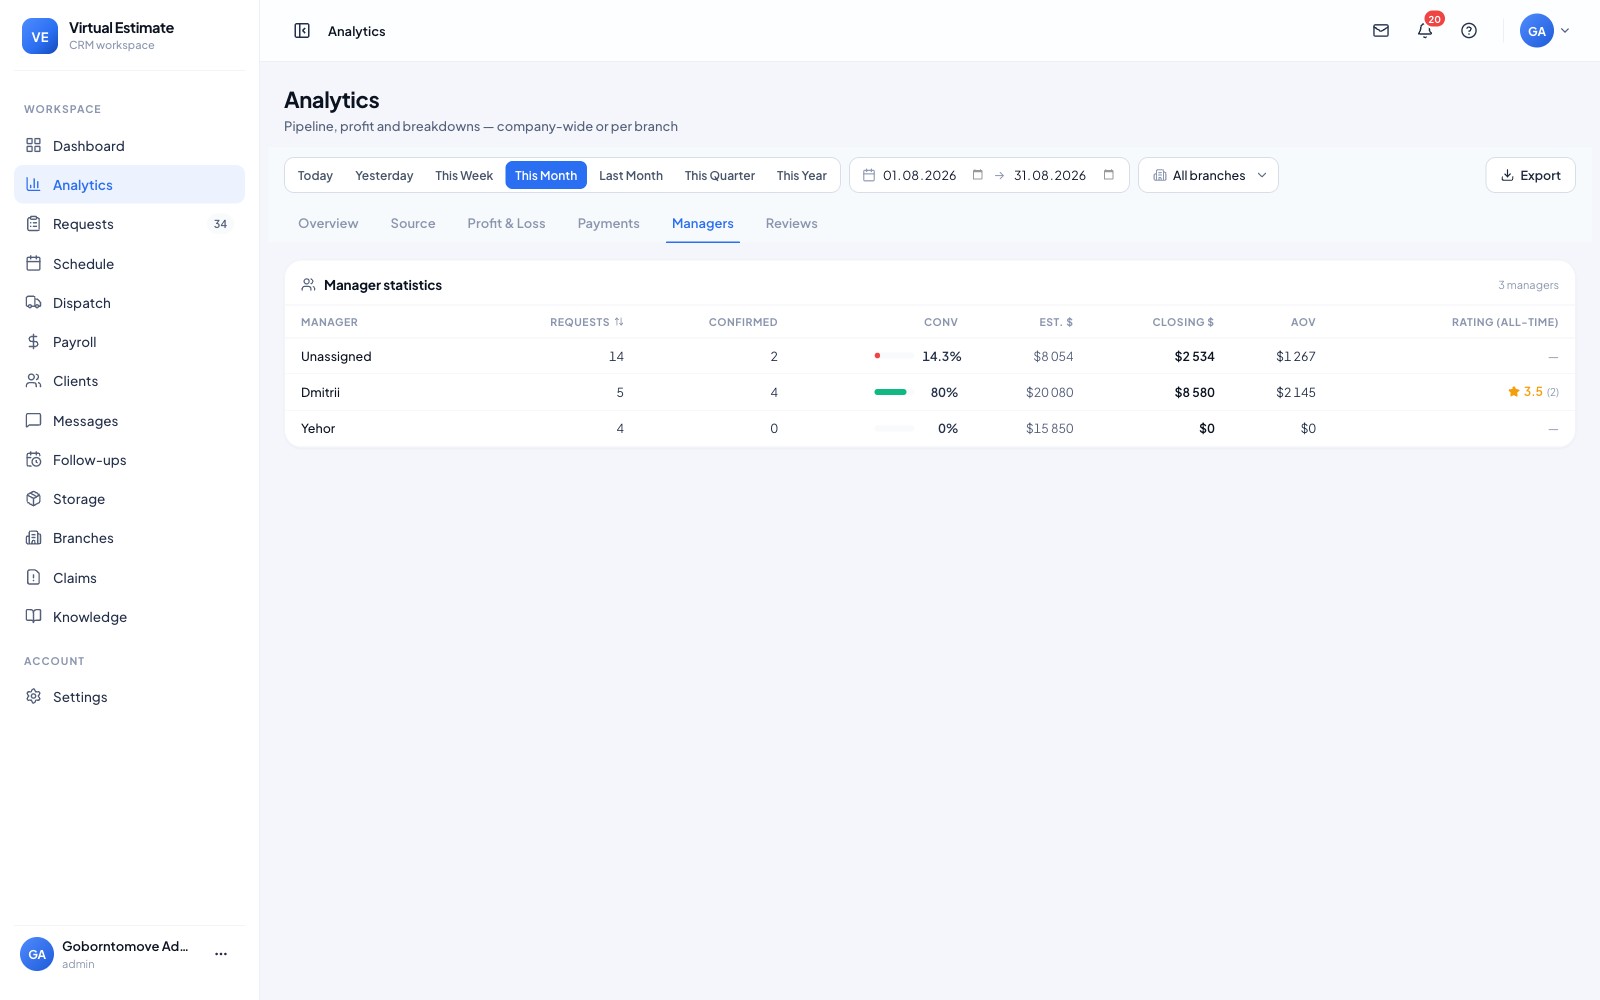
- ✓Per-manager & per-branch performance
Estimated vs. actual on every job.
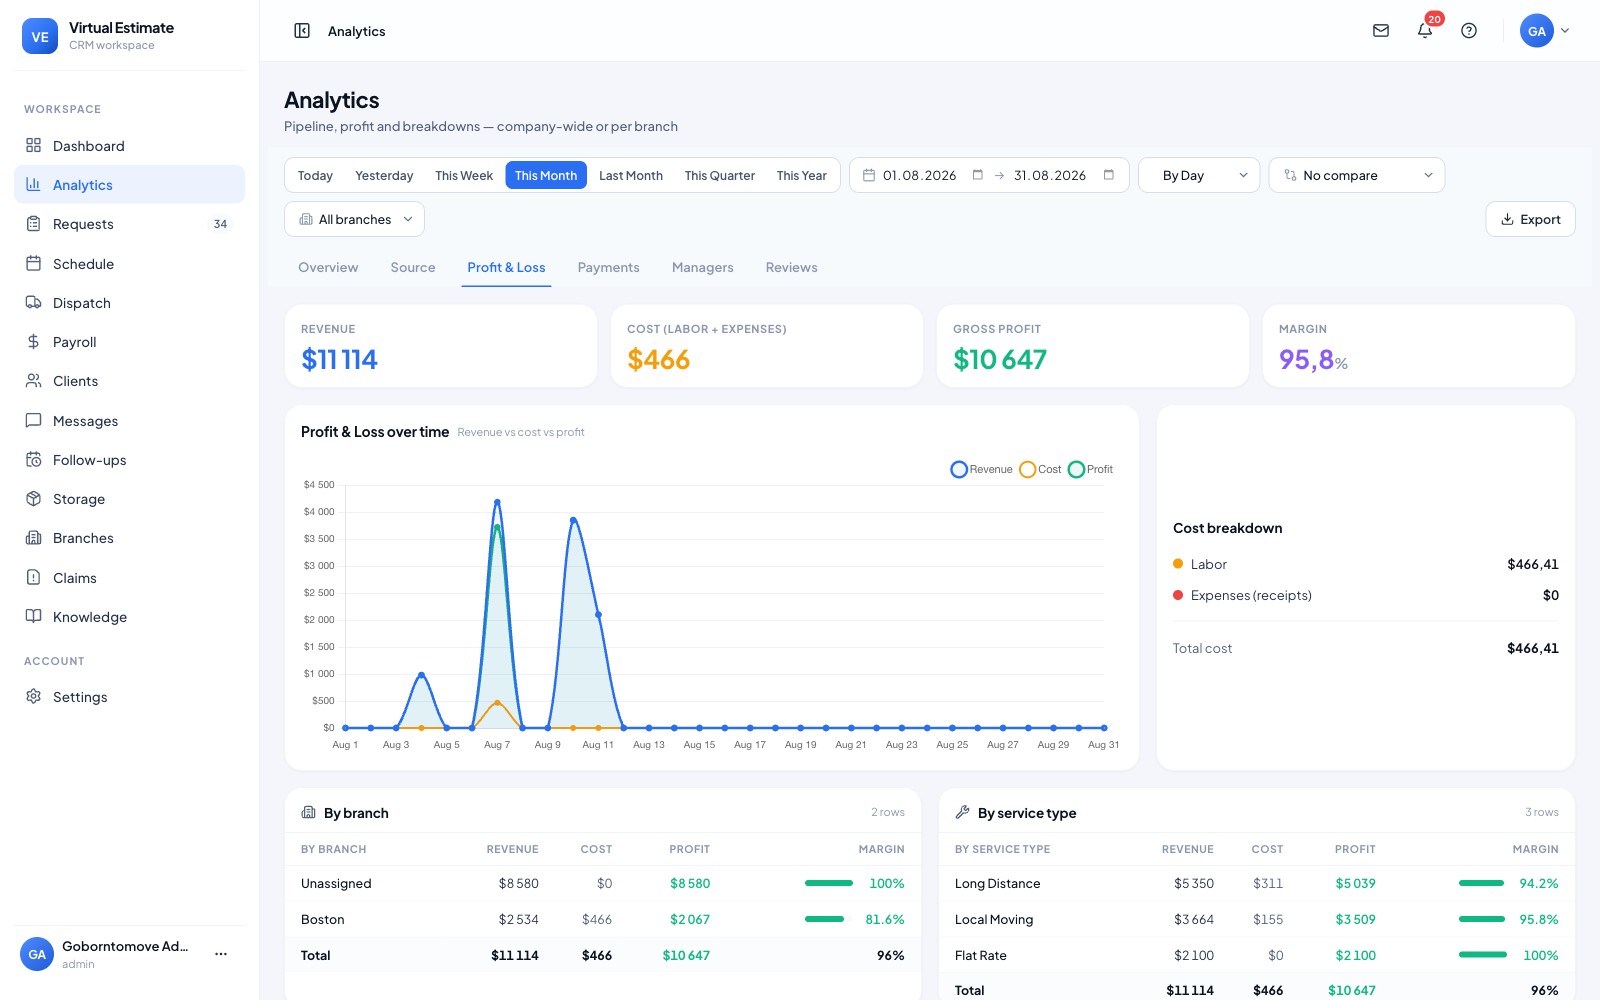
See where you make money and where it leaks — job profit tied to payroll and expenses, not a spreadsheet guess.
- ✓Estimated vs. actual profit
- ✓Funnels & conversion breakdowns
- ✓Expenses included in the P&L
From first touch to done — without re-keying a thing.
What Reporting & Analytics does for your business.
A real dashboard instead of a gut check.
See exactly where margin disappears.
Compare locations on the same yardstick.
Trends you can plan hiring and trucks around.
Most movers run on gut. This runs on numbers. Every job records what you quoted against what it actually cost, tied to crew payroll, so you can see where you make money and where it leaks.
What you get
- Dashboard KPIs at a glance.
- Estimated vs actual on every job, tied to payroll.
- A real profit-and-loss view, including expenses — not just revenue.
- Funnels and breakdowns, company-wide or per branch.
- Lead-source ROI and crew/rep performance.
Why it's different
Estimated vs actual, tied to payroll, is the number most tools never show you — it's where a price slips and a margin disappears. And because every branch has its own P&L, you can run a multi-location business on real figures instead of a monthly guess.
Yes — every job records the quoted price against the final cost, tied to crew payroll, so you can see exactly where a price slipped.
Yes — you get a real P&L and funnels company-wide or broken down per branch.
Yes — lead-source ROI shows which channels turn into booked, profitable moves.
Yes — the profit-and-loss view includes expenses, not just revenue, so the margin you see is the margin you keep.
Access is by role, so owners and managers see the numbers while other roles are limited to what they need.
One platform — every part of the move.
AI Video Estimate
Turn a customer's phone video into a measured, itemized inventory and a priced estimate — the same session, wi...
Virtual Survey
Replace the in-home walkthrough. Your customer films their own rooms from a link and answers the logistics an...
Estimate Software
Your rates, your rules — one calculator for local, long-distance and everything in between. The estimate auto-...
Ready to put Reporting & Analytics to work?
Estimated vs actual on every job, tied to payroll — a real P&L, company-wide or per branch, so you can see exactly where the money leaks.